

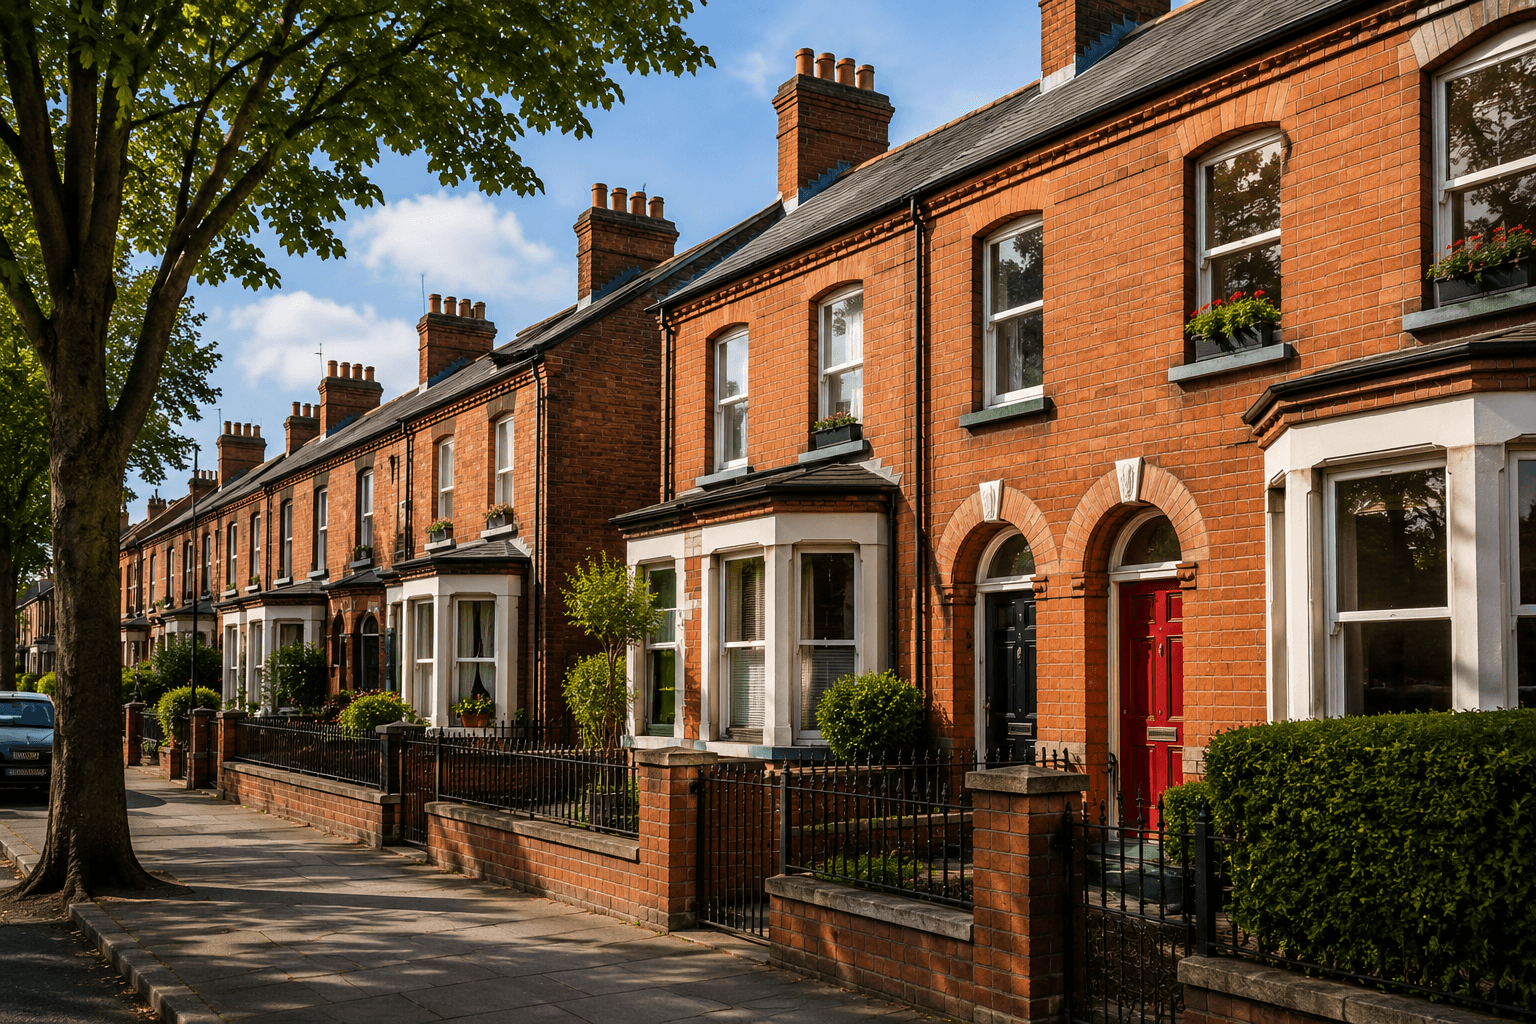
What listing activity, sale-agreed trends, and seller behaviour tell us about buying a home in Northern Ireland right now.
Q2 2026 at a glance
| Metric | Q2 2026 | QoQ |
|---|---|---|
| Properties listed | 5,618 | +815% |
| Reached sale agreed | 3,180 (57%) | +21pp |
| Median days to sale agreed | 25 days | -91d |
| Listings with asking-price reduction | 6% | -3pp |
| Median asking price | £220,000 | -19% |
ClearKey's read: Conditions this quarter present a balanced picture. Buyers should research comparable properties carefully, understand their target area's specific dynamics, and be ready to act when the right property appears — while also recognising that negotiation remains possible on stock that has been on the market longer.
1. What changed this quarter?
5,618 properties were listed across Northern Ireland during Q2 2026 — 815% more than the previous quarter (614 listings). The median asking price across all listed properties was £220,000.
This report covers 5,618 properties with a listing date falling within the quarter. Of those, 3,180 (57%) reached sale agreed during the period tracked.
Year-on-year comparison: Not available. ClearKey does not yet have a full equivalent quarter from the prior year in its dataset. Year-on-year figures will be possible from Q2 2027 onwards.
2. How competitive is the market?
57% of listed properties reached sale agreed during Q2 2026 — a moderate rate reflecting active but considered demand. This is 21 percentage points higher than the previous quarter. 61% of those homes reached sale agreed within 30 days of listing.
The median time from listing start to sale agreed was 25 days. 19% of homes that reached sale agreed did so within 14 days.
Most agreed properties move within a month of listing. This gives buyers a reasonable window to research comparables and consider an offer, but significant delay risks losing properties to other buyers.
3. Where do buyers have the most choice?
Across Northern Ireland, 5,618 properties came to market during Q2 2026. The median asking price was £220,000 across all listed stock.
By price band
The breakdown below shows how many listings fell into each price bracket and what proportion reached sale agreed.
| Price band | Listings | Sale agreed | Median asking price |
|---|---|---|---|
| Under £100k | 242 | 71% | £89,950 |
| £100k–£150k | 790 | 76% | £129,950 |
| £150k–£200k | 1,091 | 75% | £179,950 |
| £200k–£250k | 801 | 71% | £225,000 |
| £250k–£300k | 578 | 64% | £275,000 |
| £300k–£400k | 578 | 55% | £349,950 |
| £400k–£500k | 356 | 48% | £450,000 |
| £500k+ | 381 | 34% | £650,000 |
Segments with fewer than 20 listings are suppressed.
The £100k–£150k bracket had the highest sale-agreed rate at 76%, while £500k+ had the lowest at 34%.
4. Where are sellers adjusting?
6% of all listed properties had their asking price reduced at some point during the tracking period — a relatively small proportion of sellers made at least one downward adjustment. The median reduction was £10,050 (6% of the original asking price).
In the previous quarter, the reduction rate was 9% (-3pp change).
Price reductions in a listing market do not automatically translate into negotiating power — sellers who reduce are sometimes correcting an initial overpricing rather than indicating distress. However, properties with multiple reductions or extended time on market may offer more room for negotiation.
5. The Buyer's Map
The map below shows sale-agreed rates and reduction activity by area. Areas with higher sale-agreed rates had more competition for available properties.
Areas where most listings reached sale agreed
| Area | Listings | Sale agreed rate | Median asking price |
|---|---|---|---|
| Belfast East | 145 | 77% | £189,950 |
| Belfast East | 130 | 73% | £225,000 |
| Limavady | 51 | 73% | £189,950 |
| Omagh | 41 | 71% | £209,950 |
| Newtownabbey | 135 | 70% | £187,450 |
Areas where fewer listings reached sale agreed
| Area | Listings | Sale agreed rate | Median asking price |
|---|---|---|---|
| Ballycastle | 35 | 26% | £262,475 |
| Holywood & Cultra | 82 | 32% | £572,500 |
| Portrush | 50 | 36% | £330,000 |
| Strabane | 41 | 39% | £230,000 |
| Portstewart | 41 | 41% | £299,950 |
Areas with the most asking-price adjustments
| Area | Listings | Reduction rate | Median asking price |
|---|---|---|---|
| Belfast West | 48 | 15% | £124,950 |
| Downpatrick | 110 | 14% | £246,225 |
| Ards Peninsula | 96 | 13% | £200,000 |
| Newtownabbey | 88 | 13% | £169,950 |
| Strabane | 41 | 12% | £230,000 |
Areas with fewer than 30 listings in the period are excluded. A higher sale-agreed rate means more listed properties reached sale agreed — not necessarily that competition was fierce at the individual property level.
6. Property type and price band analysis
By property type
| Property type | Listings | Sale agreed | Median asking price |
|---|---|---|---|
| Detached | 2,339 | 48% | £324,975 |
| Semi-Detached | 1,573 | 64% | £209,725 |
| Terraced | 1,095 | 64% | £139,950 |
| Apartment | 611 | 56% | £165,000 |
Based on 5,618 properties with type classification. Types with fewer than 20 listings are suppressed.
By bedroom count
| Bedrooms | Listings | Sale agreed | Median asking price |
|---|---|---|---|
| 1 bed | 84 | 56% | £119,975 |
| 2 beds | 962 | 62% | £149,950 |
| 3 beds | 2,624 | 63% | £199,950 |
| 4 beds | 1,369 | 50% | £325,000 |
| 5+ beds | 522 | 37% | £475,000 |
Bed counts of 9 or more are excluded as likely commercial or multi-unit properties.
7. What this means if you're buying
Conditions this quarter present a balanced picture. Buyers should research comparable properties carefully, understand their target area's specific dynamics, and be ready to act when the right property appears — while also recognising that negotiation remains possible on stock that has been on the market longer.
On price: Asking prices are the starting point for negotiation, not the ceiling. Properties that have been on the market longer than the area's typical pace, or that have already had their asking price reduced, may have more room for an offer below asking. Well-priced properties in active segments are likely to attract early interest.
On timing: Understanding the typical pace in your target area and price band matters more than understanding the NI-wide average. The area breakdowns in this report show that pace varies significantly across Northern Ireland.
On data: This report is based on ClearKey's observed listing data — asking prices and sale-agreed signals. It does not include legally completed sale prices or mortgage data. Use it alongside independent valuation advice when considering an offer.
Methodology
All figures are derived from ClearKey's tracked Northern Ireland property listings. A 'listing' is a property observed in the ClearKey database with a listing start date falling within the reporting quarter. Listing start date is the date the property was first observed listed on the market (legacy_listed_date). 'Sale agreed' refers to a property recorded as having reached sale agreed status within the ClearKey system — not a legally completed transaction. Asking prices are the listed asking prices as tracked by ClearKey. They are not verified achieved sale prices. Price reduction figures are based on tracked asking-price changes within the ClearKey database. Days to sale agreed is calculated from the listing start date to the recorded sale agreed date. Segments are suppressed where the sample size is below the minimum threshold to avoid misleading statistics. Minimum sample thresholds: NI-wide metrics (no minimum beyond data availability); area segments (30 listings); property type, beds, price band (20 listings); velocity metrics (30 sale-agreed events). Year-on-year comparisons are not available. ClearKey's dataset does not have comparable coverage for the equivalent quarter in the previous year.
Report generated: 13 August 2026
Data coverage: 5,618 listings with a listing date in Q2 2026. 4,817 (86%) had a valid asking price. 3,180 reached sale agreed.
Limitations
- Asking prices are not verified sold prices. ClearKey's data does not include legally completed transaction prices.
- Sale agreed status reflects ClearKey's observed data, not a legal binding agreement. In Northern Ireland, sale agreed is not legally binding until completion.
- The dataset does not include all properties listed in Northern Ireland — coverage is limited to properties tracked by ClearKey.
- Year-on-year comparisons are suppressed as ClearKey does not have sufficient historical data for equivalent prior-year quarters.
- Properties with asking prices below £5,000 or above £10,000,000 are excluded as likely data errors.
- Days-to-sale-agreed metrics rely on both a listing date and a sale agreed date being present. Properties missing either field are excluded from velocity calculations.
ClearKey is a property market intelligence platform for Northern Ireland home buyers. This report is published for informational purposes only and does not constitute financial or property investment advice.
ClearKey
Track Northern Ireland’s market in real time
Save searches, follow properties and get notified when meaningful changes happen.
- Live listing alerts
- Price change history
- Weekly market reports
Free to use · Based on public listing data