

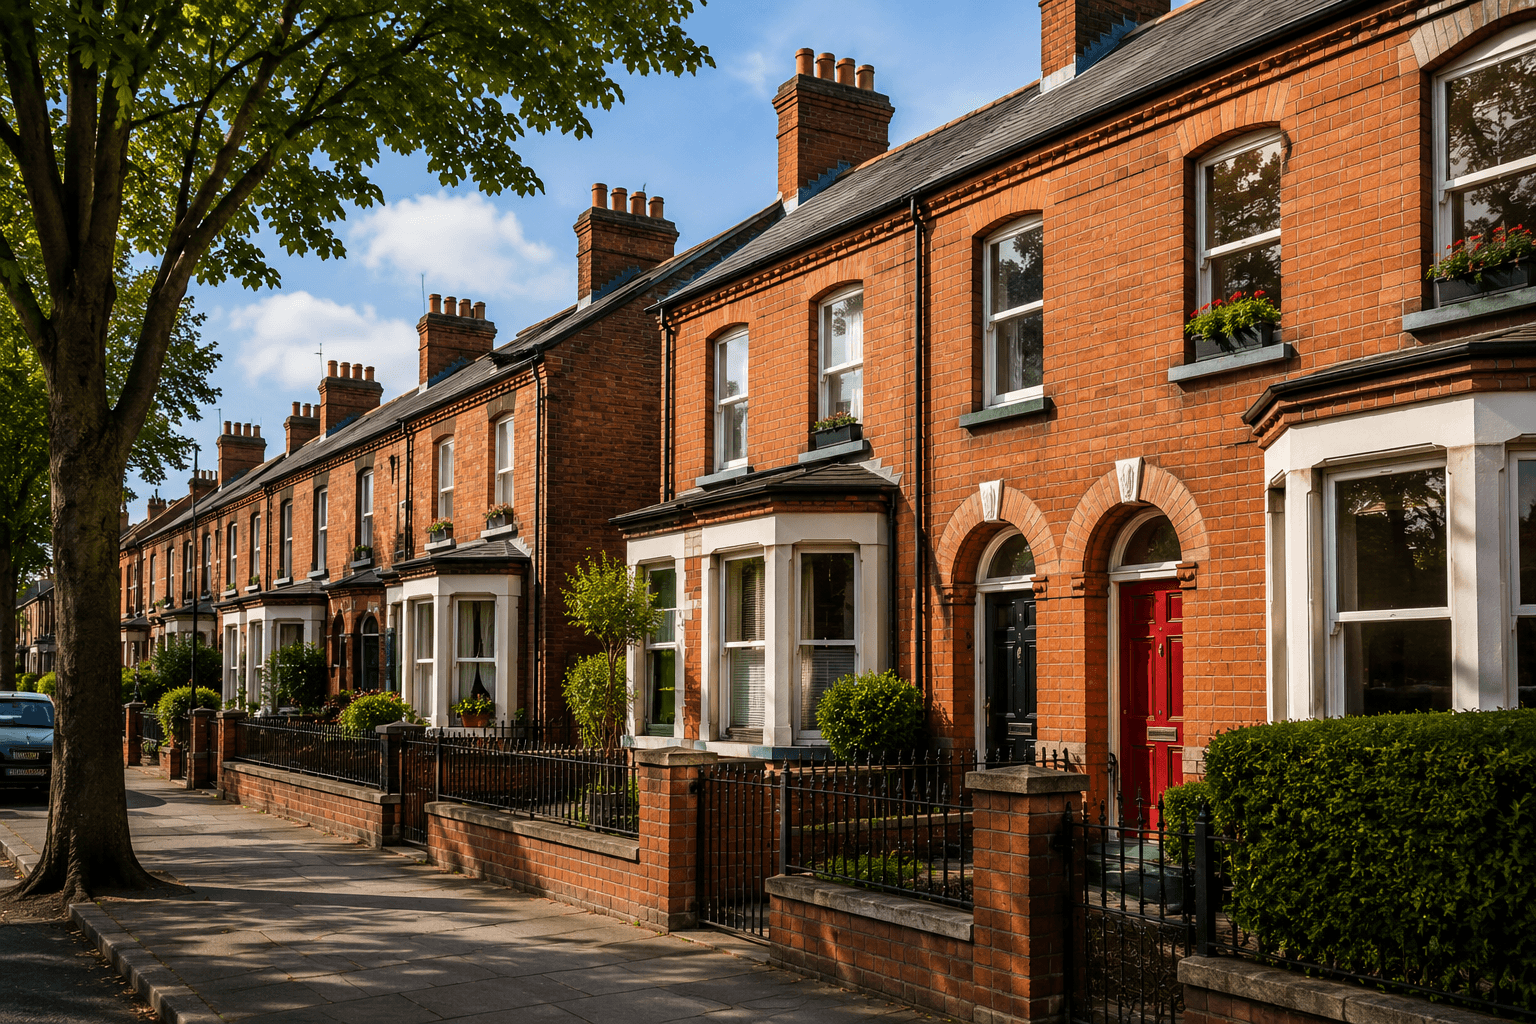
ClearKey analysed 5,619 properties listed across Northern Ireland during Q2 2026. This report covers what those listings revealed about asking prices, sale-agreed outcomes, seller pricing behaviour, and how results varied by area, price band, and property type. It is based on ClearKey's tracked listing data — not legally completed sale prices.
Q2 2026 at a glance
| Metric | Q2 2026 |
|---|---|
| Properties tracked | 5,619 |
| Reached sale agreed (by 13 August 2026)† | 3,183 (57%) |
| Median days to sale agreed‡ | 25 days |
| Listings with price reduction | 6% |
| Median asking price | £220,000 |
† Of Q2 2026 listings tracked by ClearKey. Includes sale-agreed agreements recorded after the quarter ended. ‡ Among Q2 2026 listings that reached sale agreed — not all listed properties.
Q2 2026 is ClearKey's baseline quarter. Earlier coverage is not sufficiently comparable for quarter-on-quarter trend analysis. Period comparisons will be introduced once ClearKey has a prior-quarter dataset of comparable scale. The detailed coverage ratios are documented in Methodology below.
ClearKey's read
Of Q2 2026 listings tracked by ClearKey, 57% had reached sale agreed by 13 August 2026. Among those that reached sale agreed, the median time from listing to agreement was 25 days. 6% of Q2 2026 listings had their asking price reduced at some point. Among Q2 listings tracked by ClearKey, properties in different asking-price bands reached sale agreed at materially different rates by the data cutoff. This reflects different demand levels, buyer populations, and stock characteristics across price points.
What the data shows this quarter
1. £100k–£150k had the highest cohort sale-agreed rate (76%); £500k+ had the lowest (34%)
Among Q2 listings tracked by ClearKey, properties in different asking-price bands reached sale agreed at materially different rates by the data cutoff. This reflects different demand levels, buyer populations, and stock characteristics across price points. Under £100k: 71%, £100k–£150k: 76%, £150k–£200k: 75%, £200k–£250k: 71%, £250k–£300k: 64%, £300k–£400k: 55%, £400k–£500k: 48%, £500k+: 34%
Sale-agreed rates are cohort outcomes for Q2-listed properties — not all activity was within Q2.
2. 3 beds had the highest cohort sale-agreed rate (63%); 5+ beds had the lowest (37%)
Among Q2 listings, smaller homes reached sale agreed at a notably higher rate than larger ones. This may reflect the relative size of the buyer pool at different bedroom counts. 1 bed: 56%, 2 beds: 62%, 3 beds: 63%, 4 beds: 50%, 5+ beds: 37%
Bedroom count is taken from listing data and may not always be verified.
3. Semi-Detached properties had a higher cohort sale-agreed rate (64%) than Detached (48%)
Different property types reached sale agreed at different rates among Q2 listings. This reflects the mix of supply and demand for each type across the NI market. Detached: 48%, Semi-Detached: 64%, Terraced: 64%, Apartment: 55%
Property type categories reflect ClearKey's tracked classifications, which may differ from official land-registry definitions.
1. Supply and listing activity
ClearKey tracked 5,619 properties with a listing start date in Q2 2026, with a median asking price of £220,000.
Of those 5,619 listings, 4,795 (85%) had a valid asking price recorded.
Year-on-year comparison: Not available. Year-on-year comparisons can be introduced once equivalent prior-year coverage passes ClearKey's comparability checks. This is possible from Q2 2027 onwards, subject to coverage.
2. Sale-agreed outcomes
Of the 5,619 listings tracked in Q2 2026, 3,183 (57%) had reached sale agreed as of 13 August 2026. This is the cohort sale-agreed rate — it includes agreements recorded after Q2 2026 ended, and covers only properties first listed during Q2 2026.
For context, 1,895 of those (34%) had their sale-agreed date recorded within Q2 2026 itself.
Among Q2 2026 listings with at least 30 days of observation, 34% had reached sale agreed within 30 days of listing.
Among Q2 2026 listings that reached sale agreed, the median time from listing to agreement was 25 days. Among listings with at least 14 days of observation, 10% reached sale agreed within 14 days.
Among Q2 2026 listings that did reach sale agreed, the median time to agreement was 25 days. This gives buyers some window to research comparables — but well-priced properties in active segments can move quickly.
3. Where supply was concentrated
The areas and price bands with the most listings show where ClearKey observed the greatest concentration of available stock during Q2 2026. Higher listing volumes provide more choice within a segment, but availability must be read alongside sale-agreed rates to understand how quickly available supply was being absorbed.
The £150k–£200k price band had the most listings this quarter (1,087 properties tracked).
Listings by price band
| Price band | Listings | Reached sale agreed† | Median asking price |
|---|---|---|---|
| Under £100k | 240 | 71% | £89,950 |
| £100k–£150k | 787 | 76% | £129,950 |
| £150k–£200k | 1,087 | 75% | £179,950 |
| £200k–£250k | 795 | 71% | £225,000 |
| £250k–£300k | 577 | 64% | £275,000 |
| £300k–£400k | 578 | 55% | £349,950 |
| £400k–£500k | 351 | 48% | £450,000 |
| £500k+ | 380 | 34% | £650,000 |
† Cohort sale-agreed rate: proportion of Q2 2026 listings that reached sale agreed by 13 August 2026. Segments with fewer than 20 listings are suppressed.
Areas with the most listings
| Area | Listings | Sale-agreed rate† | Median asking price |
|---|---|---|---|
| Belfast East | 553 | 71% | £205,000 |
| Belfast South | 428 | 60% | £250,000 |
| Bangor | 300 | 64% | £225,000 |
| Lisburn | 273 | 62% | £240,000 |
| Belfast West | 264 | 61% | £149,950 |
| Londonderry | 241 | 54% | £200,000 |
| Newtownabbey | 223 | 68% | £179,950 |
| Newtownards | 218 | 59% | £229,950 |
† Cohort sale-agreed rate. Areas with fewer than 30 listings are excluded.
4. Seller behaviour — asking-price adjustments
6% of Q2 2026 listings had their asking price reduced at some point — a relatively small proportion of tracked listings made at least one downward revision. The median reduction was £10,050 — around 6% of the original asking price.
A price reduction shows that a seller revised their asking price downward. It does not necessarily indicate distress or mean that a further discount will be accepted. A single reduction may simply reflect a revised pricing strategy. Multiple reductions or extended time on market can indicate different listing dynamics, but neither proves seller distress or guarantees further negotiation.
Areas by asking-price reduction rate
| Area | Listings | Reduction rate | Median asking price |
|---|---|---|---|
| Downpatrick | 110 | 14% | £239,950 |
| Ards Peninsula | 96 | 13% | £200,000 |
| Strabane | 41 | 12% | £230,000 |
| Portstewart | 41 | 12% | £299,950 |
| Ballymoney | 126 | 10% | £249,950 |
| Ballyclare | 102 | 10% | £224,950 |
Reduction rate = proportion of listings with at least one asking-price reduction. It is not a direct measure of negotiation opportunity at individual property level.
5. The Buyer's Map — where listings moved
Areas with the highest cohort sale-agreed rate
| Area | Listings | Sale-agreed rate† | Median asking price |
|---|---|---|---|
| Limavady | 51 | 73% | £189,950 |
| Belfast East | 553 | 71% | £205,000 |
| Newtownabbey | 223 | 68% | £179,950 |
| Lurgan | 152 | 68% | £197,950 |
| Crumlin & Aldergrove | 34 | 68% | £309,950 |
† Proportion of Q2 2026 listings that reached sale agreed by 13 August 2026. A higher rate means more of the listed stock in that area moved to agreement — but does not indicate price paid, competition intensity at individual property level, or whether agreements completed.
6. Property type and price band analysis
| Property type | Listings | Reached sale agreed† | Median asking price |
|---|---|---|---|
| Detached | 2,339 | 48% | £324,950 |
| Semi-Detached | 1,574 | 64% | £207,500 |
| Terraced | 1,095 | 64% | £139,950 |
| Apartment | 611 | 55% | £165,000 |
† Cohort sale-agreed rate. Based on 5,619 properties with type classification. Types with fewer than 20 listings are suppressed.
By bedroom count
| Bedrooms | Listings | Sale-agreed rate† | Median asking price |
|---|---|---|---|
| 1 bed | 84 | 56% | £119,975 |
| 2 beds | 962 | 62% | £149,950 |
| 3 beds | 2,624 | 63% | £199,950 |
| 4 beds | 1,370 | 50% | £325,000 |
| 5+ beds | 522 | 37% | £475,000 |
† Cohort sale-agreed rate. Bedroom groups with fewer than 20 listings are suppressed.
7. What this means if you're buying
The data above covers what happened to listings as a cohort — but buyers encounter the market one property at a time. Some practical points:
On asking prices: The median asking price for Q2 2026 was £220,000. Asking prices are the start of the conversation, not the end. Properties that have been on the market longer than typical for their area or price band, or that have already had their asking price reduced, may have more flexibility. Well-priced properties in active segments typically attract earlier attention.
On pace: The NI-wide median of 25 days to sale agreed covers a wide range of outcomes across areas and property types. Understanding the typical pace in your specific target segment is more useful than the NI average.
On data: This report uses ClearKey's tracked listing data — asking prices and sale-agreed signals. It does not include legally completed sale prices. Use it alongside independent valuation advice when considering an offer.
Official completed-sale context
The most recent official House Price Index (HPI) data for Northern Ireland covers Q1 2026, published by Land & Property Services / Ulster University. This data is based on legally verified completed sales — not listing data.
Standardised sale price (NI-wide): £198,015 · Price change: +7.4% annually; +1.5% quarterly · Verified completed sales: 5,009
Official HPI data provides the completed-sale picture; ClearKey's data in this report shows what buyers were encountering in the listing market. These measure different things — completed sale prices versus listed asking prices and sale-agreed signals — and cannot be directly compared.
Based on verified completed sales in Q1 2026. HPI data typically lags by one quarter — it reflects completed transactions from a prior period, not the same quarter as ClearKey's tracked listings. The two datasets measure different things (asking prices vs. completed sale prices) and should be read alongside each other.
What we're watching next
Sale-agreed pace. The median time from listing to sale agreed among Q2 2026 listings that reached agreement was 25 days. We will watch whether this figure changes in the next quarter, which will provide the first comparable data point.
Area reduction divergence. The price reduction rate ranged from 0% in Limavady to 14% in Downpatrick. Whether this spread persists, narrows, or shifts areas next quarter will indicate whether local conditions are converging or diverging.
Segment outcomes. This quarter's data showed material differences in cohort sale-agreed rates by price band and property type. Tracking whether these patterns persist, and whether the gap between segments narrows or widens, will be one of the primary questions for the next edition.
Dataset development. Quarter-on-quarter comparisons will be introduced once ClearKey has a prior-quarter dataset of comparable scale.
Methodology
All figures are derived from ClearKey's tracked Northern Ireland property listings. A 'listing' is counted once per property whose listing start date falls within the reporting quarter. Listing start date is the earliest listing date recorded by ClearKey for that property. 'Sale agreed' refers to a property recorded as having reached sale agreed status within ClearKey — not a legally completed transaction. Asking prices are listed asking prices as tracked by ClearKey. They are not verified achieved sale prices. Price reduction figures are based on tracked asking-price changes within ClearKey. 'Cohort sale-agreed rate' is the proportion of Q2 listings that had reached sale agreed as of the data cutoff. It includes agreements that occurred after the quarter ended. 'Quarterly sale-agreed activity' counts Q2 listings where the recorded sale-agreed date itself fell within Q2. Days to sale agreed is calculated from the listing start date to the recorded sale agreed date, among properties that reached sale agreed — not all listings. 'Within X days' velocity rates use an observation-window adjustment: only Q2 listings that had been listed for at least X days as of the data cutoff (2026-08-13) count in the denominator. This avoids right-censoring bias. The denominator includes all eligible Q2 listings, not just those that reached sale agreed. Area segments combine all postcode prefixes that share the same area name (e.g. BT3, BT4, BT5, BT6, and BT16 are all grouped into 'Belfast East'). Segments are suppressed where the sample size is below the minimum threshold to avoid misleading statistics. Minimum sample thresholds: area segments (30 listings); property type, beds, price band (20 listings); velocity metrics (30 sale-agreed events). Year-on-year comparisons are not available. ClearKey does not yet have comparable coverage for equivalent prior-year quarters.
Report generated: 13 August 2026
Data cutoff: 13 August 2026. Sale-agreed status is as recorded in ClearKey as of this date.
Data coverage: ClearKey tracked 5,619 listings with a listing start date in Q2 2026. 4,795 (85%) had a valid asking price. 3,183 (57%) had reached sale agreed by the data cutoff.
Limitations
- Asking prices are not verified sold prices. ClearKey's data does not include legally completed transaction prices.
- Sale agreed status reflects ClearKey's observed data, not a legal binding agreement. In Northern Ireland, sale agreed is not legally binding until completion.
- Coverage is limited to properties tracked by ClearKey — this is not a census of all Northern Ireland listings.
- Year-on-year comparisons are suppressed as ClearKey does not have sufficient historical data for equivalent prior-year quarters.
- Quarter-on-quarter comparisons were not generated for this edition.
- Properties with asking prices below £5,000 or above £10,000,000 are excluded as likely data errors.
- Days-to-sale-agreed figures are computed only among properties that reached sale agreed — not as a proportion of all listed properties.
- 'Within X days' velocity rates apply an observation-window adjustment; the denominator is eligible Q2 listings (not SA listings).
ClearKey is a property market intelligence platform for Northern Ireland home buyers. This report is published for informational purposes only and does not constitute financial or property investment advice.
ClearKey
Track Northern Ireland’s market in real time
Save searches, follow properties and get notified when meaningful changes happen.
- Live listing alerts
- Price change history
- Weekly market reports
Free to use · Based on public listing data